


Thursday, 12 June 2025
From Sand Based (1997) to the createwithpixels app (2025)
Create With has recently released its createwithpixels app on Google Play and the Apple Store. This amateur bitmap editor is for novices wanting do low-resolution raster designs on their mobile phones, or tablets. Easy to learn, the app offers a resizable pencil, plus web-friendly colour palette. Images can be exported locally, or shared via a createwithpixels.com library. Here's a short, visual story on key developments towards the app:
1997 "Sand Based"exhibit
 |
| Figure 1. Almonds and pomegranates (cycle 3), Sand based exhibit (1997) |
Figure 2's from Travis' exhibit as part of the MA Digital Arts 1996-97 group's year-end show. Middlesex University's Centre for Electronic Arts' exhibited at OXO towers, London).
 |
| Figure 2. Sand Based installation by Travis Noakes for his Middlesex University MA in Digital Art year-end's exhibit (1997). |
") |
| Figures 3 & 4. Jython test bitmap graphic captures (2001) |
")
Michael Cope wrote Jython scripts for Travis to achieve a similar effect in a PC's browser (see Figures 3 & 4).
2003 Pixel Player
 |
| Figure 5. Pixel Player graphic user interface concept page 5 (2004) |
2008-9 Crafty Pixels GUI concept
") |
| Figure 6. craftypixels.com mockup (2009) |
") |
| Figure 7. Crafty Pixels desktop application GUI mockup (2009) |
") |
| Figures 8 & 9. Pixel Player bitmap outputs (2008) |

2010 createwithpixels.com - private Alpha for desktop
Travis wrote a PhD in Media Studies proposal to study the use of creatwithpixels.com and other bitmap drawing software in High Schools. However, his preliminary research at an elite one suggested that focusing on free online portfolio software would be more worthwhile for the Visual Arts. In response, he pivoted to developing a visual arts e-portfolio syllabus (2011-13) at a private school with its HOD, and a repurposed one for a government school...2012 createwithpixels.com - public Alpha
| Figure 10. Create With Pixels homepage (2012) |
| Figure 11. createwithpixels.com configure wizard GUI (2014) |
| Figure 12. createwithpixels.com elements wizard GUI (2014) |
2016-18 Beta GUI for a mobile createwithpixels app
") |
| Figure 13. createwithpixels library GUI (2016) |
") |
| Figure 14. Color selection in the createwithpixels bitmap editor GUI (2016) |
 |
| Figure 15. createwithpixels.com testing on iMac |
2023-25 createwithpixels app v.1 development
Michael Pretorius and Rafeeq Weideman, both then at Younglings Africa, worked to prepare createwithpixels' front-end for Apple iOS and Google Android apps. Michael continued work on the app's front-end as a freelancer, liaising with Stephen Wolff to integrate with the back-end. In 2025, the Android version was approved by the Google Play Store. Likewise, the iOS version was approved by Apple's app store.Monday, 29 August 2022
Banner design changes for Google Play Store's approval of the Shushmoji app
In submitting the Shushmoji app to the Google Play store, several changes were required to the app's promotional banners before Google Play approved the app. The changes that Create With Cape Town made may be of interest to other designers preparing edgy campaigns, given Google Play Store's somewhat opaque feedback- the store simply flags which designs are rejected, but does not specify exactly which elements must change.
Below is a Slideshare presentation featuring the varying banner iterations - see if you can spot the differences? The answers follow below...
The first major change was adding a 13+ graphic in the bottom right of the presentation to comply with the policy that ‘app’s marketing imagery and text must make it clear that the app is only for young people aged 13 or older’. Subsequently, the Google Play Store calculated this rating for each country based on its app questionnaire. It decided on to a revised age restriction of 12+, so this banner is not inaccurate but will be updated with the next app version's submission.

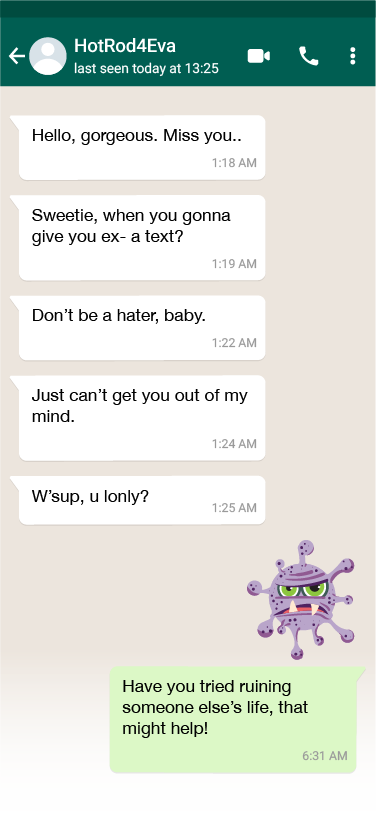
So, the banner's title was changed to 'End conversations with silly donkeys'. The WhatsApp screen graphics were also changed- the 'silly ass' part of 'Hey, silly ass' sticker set was blurred to make it obvious that the banner title is "censored". Lastly, in the left’s WhatsApp exchange ’the same species as you’ was changed to simply ‘humanity’. Out of an excess of caution, End it! was changed to End the chat! We did not want our AI Google overlord's algorithm to misinterpret 'End it!' as telling someone to end their life.


All the changes above proved sufficient to meet the Google Play Store's approval of the Shushmoji app.
Friday, 26 August 2022
Want emoji stickers to end #WhatsApp chats with #cyberbullies? The #Shushmoji app on #Android is here!


Thursday, 14 April 2022
Behind 'Design principles for developing critique and academic argument in a blended-learning data visualization course'
Our new chapter is a sequel to 'Exploring academic argument in information graphics' (2020), in which we proposed the framework for argument in data visualizations shown in Table 1. This social semiotic framework provides a holistic view that is useful for providing feedback and recognising students’ work as realised through the ideational, interpersonal, and textual meta-functions. For example, in addition to the verbal (written) mode that they are usually assessed on in Higher Education, students' digital poster designs must also consider composition, size, shape and colour choices.
Designed by Arlene Archer and Travis Noakes, 2021.


1) Delimiting the scope of the task
2) Encouraging the use of readily accessible design tools
3) Considering gains and losses in digital translations
4) Implementing a process approach for developing argument and encouraging reflection
5) Developing meta-languages of critique and argument
6) Acknowledging different audiences and the risks of sharing work as novices
"Tumi" and "Mark" followed different approaches to metalevel critique in their data visualization project's. Tumi’s presentation (see Figures 1 and 2) critiqued the usefulness of Youth Explorer for exploring education in a peripheral township community versus a suburban ‘core community’. In contrasting the Langa township ward's educational attendance data versus the leafy suburb of Pinelands, she flagged why the results may be skewed unfavourably against Langa- children from peripheral communities often travel to core communities for schooling, so data for both core and peripheral communities “can be blurred to some extent”. Tumi also flagged that youth accused of contact crime were not necessarily ‘convicted or found guilty’.

Figure 2. Tumi's limitations slide 2018

By contrast, Mark’s poster (see Figure 3) critiqued the statistics available for understanding ‘poor grade 8 systemic results’ and the reasons for higher drop-out rates in schooling between suburbs. His poster explored the limitations of what Youth Explorer can tell us about systemic tests and how these link to dropout rates and final year pass rates. He argued that a shortcoming is the dataset’s failure to convey 'the role that extra-curricular support plays' in shaping learners’ results. Mark's poster reflected the fact that many children from affluent homes go for extra lessons after school to improve subject results. This knowledge of concerted cultivation was based on his personal experience, but is unaccounted for in most official accounts of educational input.

Both cases reveal how teaching a social semiotic approach for analysing and producing argument proved helpful. It informed changes to a data visualisation poster course that could better support students’ development as critical designers and engaged citizens- the two aspirant media professionals' meta-critiques flagged important challenges in relying on data that may be incorrect and incomplete, accurately spotlighting the inherent difficulties of simplifying qualitative complexity into numbers for their audiences.
If you would like to view a presentation on our research, please visit my earlier blog post at
https://www.travisnoakes.co.za/2021/10/the-presentation-developing-critique.html.
The research is based upon work supported by the British Academy Newton Advanced Fellowship scheme. Travis’ research was supported by a Postdoctoral Fellowship (2019-21) at the Cape Peninsula University of Technology. Both authors thank the University of Cape Town’s Centre for Film and Media Studies for facilitating our research with students between 2017 and 2018. In particular, we thank Professor Marion Walton and Dr Martha Evans for their valued assistance. We also greatly appreciate the feedback from the editors and reviewers at Learning Design Voices.
Need support doing Social Semiotic research in Africa?
Both Arlene and Travis are members of the South African Multimodality in Education research group (SAME) hosted by UCT. Should you be interested in sharing your multimodal research project with its experts, please contact SAME.
Friday, 8 October 2021
The presentation 'Developing critique and academic argument in a blended-learning data visualization course', plus its hyperlinks
Slide 1
UCT Writing Centre and the Language Development Group
https://www.researchgate.net/publication/346797110_15_Multimodal_academic_argument_in_data_visualization
Thanks for watching, watch again on Slideshare
Wednesday, 6 May 2020
'Exploring academic argument in information graphics' in 'Data Visualization in Society' from @AmsterdamUPress #Academicbooks #OpenAccess
Associate Professor Arlene Archer and I wrote 'Multimodal academic argument in data visualization', which was recently published in the book, Data visualization in society. Our chapter proposes a framework for analysing and producing argument in data visualisation. This framework is applied in the chapter for investigating two second-year journalism students’ semiotic and rhetorical strategies in making arguments via data visualisation posters. We then discuss the broader implications in Higher Education for teaching students to become critical citizens via infographic poster production and analysis.
 |
| Figure 1. Data Visualization in Society book cover, Amsterdam University Press, 2020. |
The chapter drew on my fieldwork as a lecturer in the multimedia production course (FAM2017S) teaching infographic poster design to journalism students at the Centre for Film and Media Studies, UCT. I liaised with Professor Marion Walton and Dr Martha Evans in preparing a five-week course for teaching infographic poster production in 2017. Students learnt to explore educational inequalities between two suburbs in Cape Town using youthexplorer.org.za's aggregated data and to visualise their findings via infographic poster design. Arlene kindly volunteered as a guest reviewer of students' poster design progress. As novice designers, students' data visualisation arguments produced some interesting inconsistencies and disjunctures that helped inspire this chapter. Its analysis was also informed by a review of students' final posters and accompanying rationales.
In response to these concerns, Arlene proposed the framework for analysing and producing argument in data visualisation. Its components are illustrated in Table 1 below.
 |
| Table 1. A framework for analysing and producing argument in data visualisation. Archer, A. and Noakes, T. 2020. |
We are very grateful to the book's editors, Professors Helen Kennedy and Martin Engebretsen, for their feedback and help in refining the chapter.
In 2018, I retaught infographic poster design to a new group of second years and adjusted the course to allocate more for considering argument and included this framework and the article's cases for students' consideration. Both interventions helped students to improve the critical arguments in their posters. Arlene and I are writing about these changes in a draft manuscript, 'Developing critique and academic argument in a blended-learning data visualisation course'.
There are three ways you can view Data Visualization in Society digitally:
Wednesday, 8 May 2019
How strategic design informed my research blog's 2019 update
Written for researchers interested in using design strategy and brand positioning for improving their online research presences (particularly via blogs, blogsites and websites).
A. Why Strategic Design?
Table 1. High-, mid- and practice level design disciplines.
HL Design Management (i.e. brand & software & service design mx)
|
HL Strategic Design (i.e. data analysis informing brand positioning)
|
ML Design Thinking (meta-disciplinary)
|
PL Surface design
|
PL Brand design management
|
PL User-centred and experience design
|
PL Software and information design
|
PL Service design management
|
PL Curricular and instructional design
|
PL Legal design
|
PL Business design management
|
As Table 1 illustrates, the disciplines of Strategic Design and Design Management are high level (HL) strategic ones. In business, these disciplines typically seek to define and improve the long-term, 'meta' design drivers. By contrast, Design Thinking is a mid-level (ML) meta-disciplinary approach that often seeks to tackle a ‘wicked problem’ space with varied perspectives in a short burst. At the bottom of the table are performance level (PL) practices whose designers' expertise is used for providing discrete, 'micro' solutions.
For an individual blog designer, strategic design considerations may be particularly helpful for answering a big personal challenge. For example, mine was 'How do I update my research blogsite to best support my post-PhD aspirations?' To answer this, I did a strategic design process that included data analysis, a review of my personal branding plus identity development exercises. These informed my creative brief to Jon, plus the ongoing development of this blogsite.
To improve my blog's usability and personal salience, I made the following design changes:
+1> My roles were simplified;
+2> I checked how each role and my research interests were reflected in my labels;
+3> My publication plan addresses my diverse roles and interests;
+4> I reordered my 'research' navigation to support the postdoctoral publication hierarchy;
+5> I also took other measures for improved reliability;
+6> plus security.
+1> Refined my personal brand positioning and roles
Online spaces can provide ready opportunities for individuals to experiment with digital personas. As part of my PhD's broader identity exploration project, my blog featured five roles in its navigation. These were 'researcher', 'designer', 'educator', 'public speaker' and 'volunteer'.
While accurate in terms of identity exploration as a PhD candidate, it made for a complex and potentially confusing navigation structure on the mobile phone (see left in Figure 1). It also seemed important to simplify identities to reduce that inevitable 'he's a jack-of-all-trades' perception!
 |
Figure 1. travisnoakes.co.za navigations (version 2016 vs 2019) in mobile screen by Jon Wheelan, 2019.
|
To solve both challenges, I did an exercise for simplifying my identity by clearly defining the three roles I prefer to do. Such consolidation also supports a simpler overall online persona that is easier to keep coherent (i.e. I might describe the same roles on; LinkedIn for work, academic portals for research; Twitter micro-blogging or Facebook for friends). My roles were prioritised down to the big three of: 'researcher', 'design steward' and 'techné mentor'. Interestingly, researching design strategy introduced me to the unusual 'design steward' and 'techné mentor' roles: The former reflected how my career in design increasingly involved briefing designers and sharing their work, versus my own designs. As a ‘techné mentor’, I am involved in fluid, once-off educational interventions related to technology. My previous roles (such as speaker and volunteer) proved easy to re-house under the simpler navigation (see right in Figure 1).
+2> Checked that my Postdoctoral roles and interests are covered in Blogger labels
I've tried to make my blog easy to search by using Blogger 'labels' for each of its posts. By analysing my use of labels and how these relate to my roles, I learnt that there were far more articles that related to my role as a techné mentor, than as a researcher or design steward.
 |
| Figure 2. travisnoakes.co.za label review |
Speaking of which, I have prepared a research publication plan that primarily includes research articles from my PhD, the online academic bullies and mobs project and this blog. Over time, I hope to feature more design-related posts on this blog, plus visual designs. This will create a clear shift with content previously dominated by my PhD research and related techné mentorship concerning e-portfolios.
Another important shift lay in switching the priority of navigation options under my researcher button. Back when I was a PhD candidate, it was most important to get feedback via conferences on my manuscripts and presentations. However, both are near the bottom of a traditional academic publishing hierarchy. Postdoc application requirements reflect this hierarchy in spotlighting emergent scholars' publication of research articles (and/or chapters). My revised navigation reflected this hierarchy by first featuring articles and first chapters. It then provided a link to my thesis' abstract, my conference papers and Slideshare account. Overall, this structure is fairly future-proof, since it is easy to add new research material to and for users to follow.
+5> Improved research blogsite's reliability
Blogger's widget layout system makes it very easy to add functions to one's blog. A downside of adding content from third parties (such as one's researcherID badge...) is that these may not have been tested in Blogger widgets, nor on all browsers. One side effect can be that widgets alter one's layout (... which influenced this blog's body text layout after it exceeded a certain width in Google Chrome). Running Google Chrome error reports also flagged issues with select add-ins. In response, I updated all profile badges and combined them into as few widgets as I could to increase reliability Defunct services, such as my Google+ profile and related pages, were removed. In their place, I added the curatorial accounts of Pinterest and Diigo accounts.+6> Secured research blogsite with the https protocol
I hope this post will inspire others to apply strategic design practices and brand positioning for improving their online research presences.
Monday, 1 October 2018
Knowledge gaps in African design for my Post-doc research to address
Doing a PhD helps one understand that there are many gaps in human knowledge. It helps clarify the existence of important gaps and challenges one to do appropriate research that help with closing them. As part of writing Post-doctoral Fellowship applications, it became important to reflect on what my inter-disciplinary media studies research contributions have been so far and how I might build on them, and move onto new topics, in the future:
In working for UCT's 'ICT Access and Use' project (2011/12), I explored how media students followed a form of connected learning for developing identities linked to creative industry as undergrads. Together with Associate Professors Cheryl Brown and Laura Czerniewicz, we addressed a gap in the literature regarding university students’ extramural creative production with varied online services. Three case studies illustrated how Connected Learning can be empowering: each student provided a vivid example of digital practices embedded within social contexts, exemplifying the processes students undertake when constructing meaning and knowledge in the digital world. Such cases have been lacking in the literature, especially from developing country contexts (GAP1). Future research can build on ours by exploring how Connected Learning is experienced in other South African contexts and more broadly in the global South.
My PhD thesis contributed to closing a research gap concerning digital inequality. Its research described how the e-portfolios of young Cape Town visual arts students at two secondary schools were shaped by their privileged or marginalised circumstances. There is an opportunity to extend this pathfinder project by looking at completely underserved schooling environments. For example, what digital repertoires are young visual creatives in Cape Town's marginalised settings (poor suburbs in schools without support for visual art or design) developing (GAP2)? This focus also suggests an opportunity to combine research interests in connected learning and participatory culture for exploring the visual creative productions that occur in underserved contexts outside formal academic settings in Cape Town and how these repertoires link to academic cultural capital, or not (GAP3). Multimodal researchers could also explore the longitudinal changes to visual creatives' e-portfolios (GAP4). For example, how students change their e-portfolio styles after leaving school and preparing to apprentice in creative industries or helping justify future study).
- What are the advantages and pitfalls of young online content creators developing their technical cultural capital plus digital symbolic capital?
- How are social networks and technical cultural capital becoming more important as determinants of opportunity (see Jenkins, Ito and boyd, 2016).
- How are people being included, or excluded, in participatory culture based on their cultural, ethnic, gender or racial affiliation?
- How might such differences be echoed or different in the global South?
- How are inequalities of opportunity reproduced via schooling and how might this be or challenged?
- How does cultural taste impact on what is valorised or dismissed and which identities and communities of practice are permissable in different creative contexts?
- What novel forms of creative production result from new media literacies and how do creators perceive them to be successful, or failures?
I am currently preparing Post-doctoral Fellowship applications for Cape Town universities and the positions that might support research contributions to (1- 7) and tackling GAPS1-4 are very scarce.
A further challenge is that justifying a Post-doctoral fellowship position requires a narrow focus on the type of gap selected. One's post-doc work is required to develop knowledge that moves one's 'field' forward by addressing its 'critical knowledge gaps'. As an interdisciplinary researcher, whose PhD has spanned disciplines ranging from media studies to cultural sociology, the academic field I must contribute to seems blurred and difficult to address. Which 'field' and what 'gaps' must my interdisciplinary focus prioritise? Which unrelated threads of work can I link that might change current research? What concepts and approaches can be extended to address critical knowledge gaps in my field?
African design is an understudied and emergent field, which could benefit from more scholarship documenting its existing practices (Venter, 2018)}. After lengthy consideration, I have decided to develop an inter-disciplinary proposal for this field that addresses three distinct, but overlapping, concerns related to bitmap design, digital access and collaborative software design:
The first concern is what bitmap designs are marginalised young creatives producing and sharing online? This online content analysis will serve as a starting point for exploring the second concern- what does 'access' to digital design really mean in under-served contexts. For example: How accessible are apps and open source software to mobile-centric designers in highly constrained circumstances? What role does English as a 'global language' play in shaping Xhosa mother-tongue creatives' access and use to bitmap software? What cultural repertoires (i.e. fashion, gaming) seem to motivate interest in being a bitmap designer? The final concern is to contrast what happens when design thinking and design strategy approaches are used for collaborative software design focussed on localisation. I will describe the benefits and limitations of both, using workshops for aspirant, but under-resourced, visual creatives. They will be consulted for understanding how Create With's new functional specifications for https://www.createwithpixels.com might provide better access for young South Africans.
By addressing these three concerns, my Post-doc research should make a solid contribution to the field of African design. It addition to its novel exploration of bitmap designers' content and circumstances, it should also generate interesting findings concerning the meanings of 'access', plus the differences between two design approaches' outcomes for collaborative software localisation.
Thursday, 8 March 2018
Missing social information and disidentifiers in digital self-presentation
I submitted 'Inequality in Digital Personas- e-portfolio curricula, cultural repertoires and social media' in mid-February. Some of my thesis' findings and recommendations were removed to meet the 80,000 word restriction. This redacted writing may still have some value to researchers, so I'm sharing them as blog posts. Here's the first (all will be labelled 'PhD' for ease-of-finding):
Research background and three key contributions
Moving image media have become central to the learning and everyday life experiences of young children (Buckingham, 2003, 2013). However, such media are largely ignored in multimodal research, despite its acknowledgement of the importance of computer games, film and television (Kress, 2010). My research made a novel contribution by focusing on visual arts e-portfolio styles. This benefits research into the broad range of texts in the classroom that have resulted from the impact of digital media in the last decade (Bazalgette and Buckingham, 2013).
My action research project (2009-13) enabled students at two sites, an independent and a government school, to be taught the creative appropriation of online portfolio software, Carbonmade, for curating their electronic learning portfolios (e-portfolios). The two very different sites were chosen for the following reasons: first, I wanted to explore a wide range of students' choices that economic, cultural and social differences might contribute to; secondly, the bandwidth costs of online publication are significant in under-resourced settings (Donner and Walton, 2013), and thirdly, there are massive differentials in South Africans' general levels of access to, and familiarity with, online media (Goldstuck, 2010, 2017).
Aside from assisting students with developing new media literacies as digital curators, my investigation also made valuable contributions through two other methodological innovations. Its longitudinal nature is unusual amongst multimodal studies in spanning three years (2010-12) at an independent school and two years (2012-2013) at a state one. Diachronic changes in students’ digital designs were examined through the novel methodological contribution of a screenshot analysis. My third contribution is an original description of how young people’s access to digital infrastructures influenced their development of a digital hexis for e-portfolio curation and the modal density of their e-portfolio styles.
Although multimodal content analysis proved highly useful, my thesis did not focus on contributing to social semiotics. Nevertheless, interesting findings emerged that contribute to multimodal theory: Researchers have described the dangers of stigma (Trottier, 2013) and oversharing (Agger, 2012) in peoples' digital self-presentations, but little has been written on the absence of social information as missing identifiers (Goffman, 1963) or concerning disidentifiers.
1. Understanding missing identifiers
Signs may be called symbols where signs are available to convey social information that is frequently and steadily available and routinely sought and received (Goffman, 1963). In e-portfolio curation, students might be unable to add information to particular identifying categories. This could result in their online identities missing identifying information that audiences would typically expect in a showcase digital portfolio.
Digital self-presentation as an online exhibition
Impression management is the term used to describe how a performer tweaks his or her performance to consciously give details or unintentionally give off details that leak off without any intention (Goffman, 1963). Notions of impression management have proved a useful theoretical foil for understanding online behavior (boyd, 2007. Marwick & boyd, 2011. Mendelson & Papacharissi, 2010. Lewis, Kaufman & Christakis, 2008. Quan-Haase & Collins, 2008. Schroeder, 2002. Tufekci, 2008). Goffman's dramaturgical metaphor situates impression management within a specific bounded place, drawing on the concept of a behaviour setting (Barker, 1968) in which behaviour is driven by the norms and goals of specific settings. This delimited place is distilled into a dichotomy between front- and back regions, colloquially front stage and back stage. In the front stage, the actor tries to present an idealised version of the self that accords to a specific role. In my research, pupils were assessed on their front stage self-presentation as visual arts students. Students' curations of digitally disciplined personas drew on varied repertoires from a backstage, where the real work necessary to keep up appearances is done.
Goffman's dramaturgical metaphor is focused on synchronous performance in a situation where the performer is co-present with a live audience and can adjust his or her behaviours in response to their feedback. However, many social media sites provide communicative situations that are dissimilar to face-to-face ones. These situations do not depend on being bounded in space and time, nor supporting co-present, real-time observation between individuals (Miller, 1995). Consequently, it is more appropriate to use an exhibition metaphor than a stage play (Hogan, 2010), for social media artefacts. E-portfolios, for example, are presented asynchronously in space for many possible audiences:
Hogan defines an exhibition site as a site (typically online) where people submit reproduced artifacts (read: data). These artifacts are held in storehouses (databases). Curators (algorithms designed by the site's maintainers) selectively bring artifacts out of storage for particular audiences. Audience in these spaces includes those who have used the artefact or make use of it. There are two components of an exhibition space; in the first, information signifying an individual is delivered to the audience on demand by a third party. In the second, the reproducibility of the content and the database curator's role in distributing it means that the submitter does not continually monitor the data as the audience receives it. Nor may the contributor fully know his or her invisible audience(s).
The exhibition metaphor is highly appropriate for describing visual arts showcase e-portfolios, since these are exhibitions that are doubly curated; being self-curated by students, who organise digital content, that is redistributed via the virtual curatorship of an online portfolio service's database(s). The context of this exhibition space can stand in for the dramaturgical context of a specific setting (Schroeder, 2002). In contrast to the latter situation, the artist and his exhibit's viewers are not co-present in space in real-time, but may still monitor and react to each other. Furthermore, while the artist may order artefacts with a particular audience in mind, those who view and react to the content may be different from those for whom it was intended. This exhibition approach expands, but does not replace, the dramaturgical approach since each artist may adjust his or her self-presentation on an ongoing basis in response to audience feedback. An advantage of this expanded approach is that it can support a clearer articulation of the potential and perils of self-presentation in an age of digital reproduction (Hogan, 2010).
The expanded approach is also helpful for addressing the major difference between an embodied actor with a pre-existing physical presence, versus the disembodied e-portfolio exhibition space. Its creators must enter, select and upload information to create their digital presences. In e-portfolio production, students should have greater opportunity to exercise impression management and make strategic choices in what information they might provide through different modes. These modes provide different resources that students can use to control their information and affect not just what young people are able to reveal, but also what they are able to conceal (Jones, 2005).
Linking missing information to marginalised students' limited infrastructural access
Software both enables and constrains users' communications (van Leeuwen & Djonov, 2013) through posing particular kinds of representational and communicational choices. The degree of design and customisation afforded by Carbonmade, as well as what software does not offer users (van Leeuwen, 2008), shaped students' e-portfolio styles. For example, free Carbonmade users had very limited options for customising portfolio layout. Unlike paid users they cannot upload a custom logo or feature big images.
In curating online personas, few keen students would set out to produce digitally disciplined identities that were incomplete showcases, since this might potentially compromise their credibility. Nevertheless, for first-timers, the task of e-portfolio design work can be overwhelming (Yancey, 2004) as it may involve many unfamiliar tasks. These can include: identity work; remediation of creative productions and their arrangement for diverse online audiences; and being ‘web sensible’ in exploiting the affordances of the digital space (such as hyperlinks). While the on-going maintenance of e-portfolios may involve seemingly simple processes, their quantum contributes to it being a complicated medium for novices to manage. They often needed to do several updates for achieving currency and coherence.
Such a requirement placed marginalised students at the greatest disadvantage in being under-resourced in not having home computer and internet access. They had to make choices during e-portfolio lessons, where they were hampered by their inexperience with computers and the internet. Highly constrained access to digital information infrastructure limited these teens' development of a digital hexis for e-portfolio production. The concept of a digital hexis was proposed by Fanny Georges (2007) to designate a scheme of user self-representations. These self-representations are transformed like a body that is shaped by habit or by repetitive practice. Thus, the notion of hexis bears analogy with the shaping of meaning and body. The extent to which digital identities are produced is drawn from repetitive interactions and continuous perception of self-representations on the screen (Georges, 2009, p.1). Participants as e-portfolio curators, thus evidenced a digital hexis in their e-portfolio's self-description, imagery and level of organisation. These young people's accomplishments in evidencing digital hexeis via e-portfolio styles were thus closely linked to opportunities for regularly accessing and using digital information infrastructures.
In analysing all research participants' e-portfolio styles, different patterns between the two sites suggested that young people's material circumstances were reflected in the extent of their digital self-descriptions and portfolio organisation. In particular, inequalities in histories of digital infrastructure's access and use (for example "free" internet Wi-Fi) led to large differences in the levels of modal density (Norris, 2009) of e-portfolios at either site. Students’ multimodal texts can be dense in meaning, given that each mode adds its particular layer of complexity. According to a Multimodal (inter)action analysis approach (Norris, 2004, 2014), each students’ e-portfolio had a particular level of modal complexity. The more intricately intertwined a webpage’s multiple disembodied modes (such as image, text and layout), the higher the density. Differences in the densities of e-portfolios were linked to the digital hexis for e-portfolio curation that teens could exercise. Thus, class and digital divides were evident in the extent to which digital personas and imagery was curated.
High ad-hoc broadband rates serve as gatekeepers to data intensive practices by mobile-centric users, such as e-portfolio curation. In South Africa, pay-as-you-go mobile phone contracts prioritize use of voice and SMS services. For affluent consumers, able to afford big data bundles, data can be amongst the cheapest in the world, at eight cents per megabyte upfront (Goldstuck, 2016). By contrast, the punitive ceiling rate of up to R2 per megabyte for “out of bundle” mobile data can be subtracted from ad-hoc users’ airtime, putting it amongst the highest rates in the world. Data bundles are not perceived as an essential purchase by the poor and so are rarely bought. They consider bundles as cheap as R25 to be unaffordable, despite these enabling major savings in the cost of ad hoc data (Goldstuck, 2016).
Under-resourced students had to be highly resourceful to participate in e-portfolio production, given such costs and their difficulties in accessing digital cultural capital (Selwyn, 2004; Seale, 2012). Such marginalised youths reported not being able to produce e-portfolios to their satisfaction. By contrast, privileged students at both schools expressed dissatisfaction with the limitations of the 'visual arts showcase' e-portfolio as a school genre. Students who had “free” home internet could do e-portfolio work at their leisure, which tended to result in these teens sharing not only extensive information about their classroom roles, but their informal ones, using better production values and modally denser styles. Such teens pushed Carbonmade’s free online portfolio storage to the limit and some took advantage of their out-of-class infrastructural advantages for creating extra-mural portfolios that overcome storage limitations and provided a forum to circumvent the e-portfolio guidelines. A few students linked such "unofficial" portfolios from their e-portfolios.
2. Describing disidentifiers
In addition to students' e-portfolio styles missing social information, they also evidenced disidentifiers (Goffman, 1963), whereby signs broke-up the coherence between self-presentation and portfolios that students had tried to create. Teens' feedback suggested that they did not deliberately select signs that resulted in misrepresentation on their webpages. The presence of disidentifiers suggested novel self-presentation and content production problems when young people's multimodal choices become remediated online:
Just as Potter highlighted about children's' video-making (2012, p. 33), not every video, 'ends up as the coherent, fully designed, literate and realised use of meaning-making resources envisaged by some semiotic theorists'. My research likewise highlights the constraints of teenagers as multimodal designers. In particular, it is important to understand the (often hidden) role of digital infrastructure as an influence on their design process. Inequalities in the access and use to such infrastructures may enable certain styles of self-presentation or act as a gatekeeper, especially for marginalised teens. Non-internet connected students described being unable to publish the social information or artwork showcases they wanted to. In the absence of information on digital infrastructure in their e-portfolios, it was difficult for viewers to appreciate how differing contexts shaped the quantum and styles of visual and social information that users provided. For example, it is hard to spot that under-resourced students had put a lot of effort in making workarounds to overcome slow and unreliable ICT infrastructures. Another concern lay in students not deliberately choosing multimodal ensembles: default software values created disidentifiers that inexpert teenagers missed editing or forget to change, which resulted in misrepresentation of teens' interests.
Scholars who celebrate accounts of teaching contemporary digital media production with new media literacies (Jenkins, 2006. Burn and Durran, 2007. Lankshear and Knobel, 2009. Ito et al, 2010. Jenkins, Ito & Boyd, 2015) would tend to promote the integration of such like arts e-portfolios at schools. Likewise, teachers believed that publishing the prescribed style would be beneficial for all. By contrast, the content analysis and case studies of a range of students' e-portfolio styles revealed the exclusionary impact of infrastructural inequality. My content analysis and case studies for twelve teens revealed how highly constrained access to digital information infrastructure limited marginalised teens’ development of a digital hexis for e-portfolio production.
When analysing digital curators' productions, semiotic theorists should not assume that incoherence, outdated information and the low modal density that results from missing social information solely reflects unmotivated students’ disinterest. Rather, it is important to consider how low production values might also result from keen youths who face infrastructural constraints that prevent online content curation and digital remediation.
Describing the infrastructural constraints that students experienced is consequential as it shows educators and other decision makers that youths’ differential resourcing must be accommodated in curricular design. For example, lessons should aim to prioritise infrastructure use by under-connected students. Teens’ mobile infrastructures must be better accommodated and students should be encouraged to describe infrastructural enablers and constraints in their e-portfolios. Future researchers should look at the outcomes of specific changes in class and whether they help promote greater equity, or not?
The absence of expected signs in an e-portfolio are missing identifiers that may reduce its value when viewers interpret a prospective apprentice or student's digital portfolio to be incomplete and not a 'proper showcase'. The prestige of the symbolic capital that students may develop via digital curations is linked both to the quality of the artworks they remediate and their organisation. Where students choose to be online, but produce partial, disorganised portfolios that do not reflect their best works, such curations may be judged to be inadequate and discredited by assessors or prospective employers. Audience research needs to be done concerning the reception of young people's e-portfolios. For example, how do assessors grade for missing identifiers and disidentifiers when evaluating digital arts portfolios for university access.
My research took place in two relatively well-resourced English secondary schools that could provide the visual arts subject, but future research could be done into the choices that young people make in the less well-resourced environments that are more common in South Africa. For example, how do non-dominant teens negotiate their cultural exclusion at school in creating digital personas that remediate their mother tongues and other repertoires?
More research also needs to be done concerning young adults' development of varied digital portfolios as they enter tertiary education, the workforce and other spaces. For example, how do young peoples' online portfolio styles change as youth become professionals or hobbyists?
People use multiple profiles to support job searches that may involve switching from one profession to a new one. There is an opportunity to research how young adults manage multiple profiles with limited internet access. Researchers must also explore how other constraints influence young adults' design of digital personas. For example, while online spheres are increasingly considered public, they are a source of tension for prospective employees. Older people voiced fears about being screened out of potential work interviews if they post self-image photos on LinkedIn (Sharone, 2017). The ease with which HR recruiters can search young adults' "Google resumes" and their attendant fears of evaluation is likely to inhibit certain expressions online. Researchers could examine the extent to which young adults remain silent about their political and social justice views to 'fit in' with prospective employers.


 orcid.org/0000-0001-9566-8983